States of matter:
The three states of matter are solid (such as ice, stone or wood), liquid (such as water, oil or ethanol) and gas (such as water vapour, oxygen or air).
Solids, liquids, and gases differ in the arrangement and movement of their particles as follows:
Solids
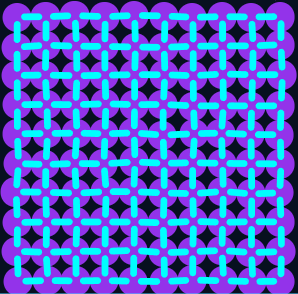
- Arrangement: Particles are touching and organised in a regular 3D pattern.
- Movement: Particles are vibrating around a fixed point, but cannot move around.
- Explanation: The particles in a solid are held in place by strong forces of attraction called intermolecular forces, which prevent them from moving.
Liquids

- Arrangement: Particles are touching and in a random arrangement.
- Movement: Particles are moving freely.
- Explanation: The intermolecular forces between the particles have been partly broken, meaning the particles are still attracted to each other, but not strongly enough to hold them in fixed positions, which allows them to move.
Gases
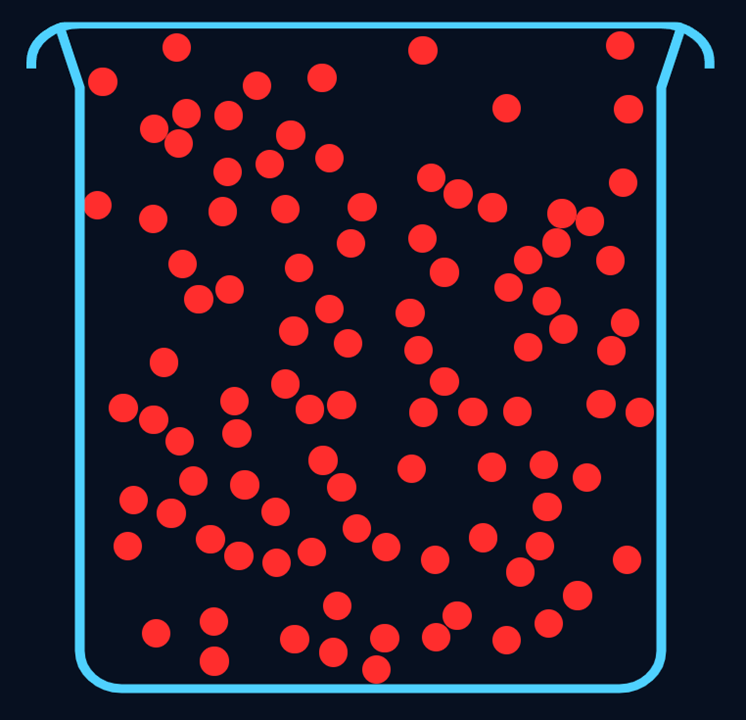
- Arrangement: Particles are spaced far apart and in a random arrangement.
- Movement: Particles are moving freely very quickly.
- Explanation: The intermolecular forces between the particles have been entirely broken meaning the particles move freely with no attraction to each other.
Try this in the simulation:
- Switch the Select state toggle between Solid, Liquid and Gas to see the three states, note their arrangement (regular and touching for solid, random and touching for liquid, random and spaced for gas) and their movement (vibrating for solid, moving for liquid, moving quickly for gas).
- Toggle Show intermolecular forces to Show and see how in the solid there is a fixed grid of intermolecular forces holding the solid particles in place, for liquid there are fewer intermolecular forces per particle and they are continuously breaking and reforming as the particle move, whilst in gas there are no intermolecular forces.


