Scarecrow explains
Cell membranes have lots of tiny pores (small holes)* in them, allowing some substances—such as water—to easily pass through them, whilst others—such as glucose, salt and other dissolved solutes—cannot. As such, we describe cell membranes as being partially permeable, because some substances can pass through them whilst others cannot.
Osmosis is the diffusion of water across a partially permeable membrane down a concentration gradient from high water concentration to low water concentration. The concentration of water is higher when the concentration of dissolved solutes—such as glucose and salt—is lower, and vice versa, so in osmosis, the water diffuses towards the side with higher solute concentration where the water concentration is lower.
During osmosis, it is the water molecules that have to cross the partially permeable membrane, because the solute molecules cannot pass through the holes in the partially permeable membrane. Osmosis stops once the concentration of water molecules (and therefore solute molecules) is equal on either side of the membrane, however, this does not mean that water molecules stop crossing the membrane, just that equal numbers cross in either direction.
*Note: More formally, these holes are known as pores or channels, and there are many different types for different substances, such as aquaporins which allow water in and out, and glucose transporters which allow glucose in and out. For the sake of understanding osmosis, we can consider that only the aquaporins are open, meaning only water can currently cross the cell membrane.
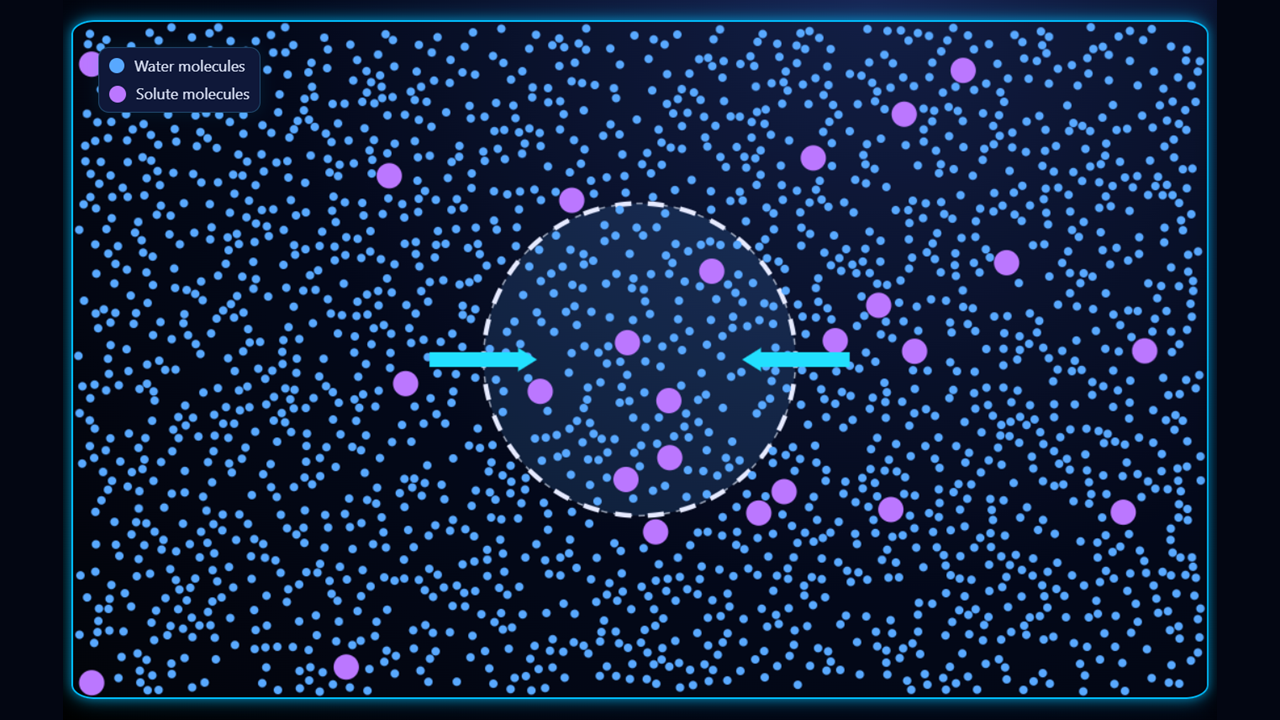
In osmosis, the water moves from the lower solute concentration (hypotonic) side of the membrane to whichever side of the membrane has higher solute concentration (referred to as hypertonic).
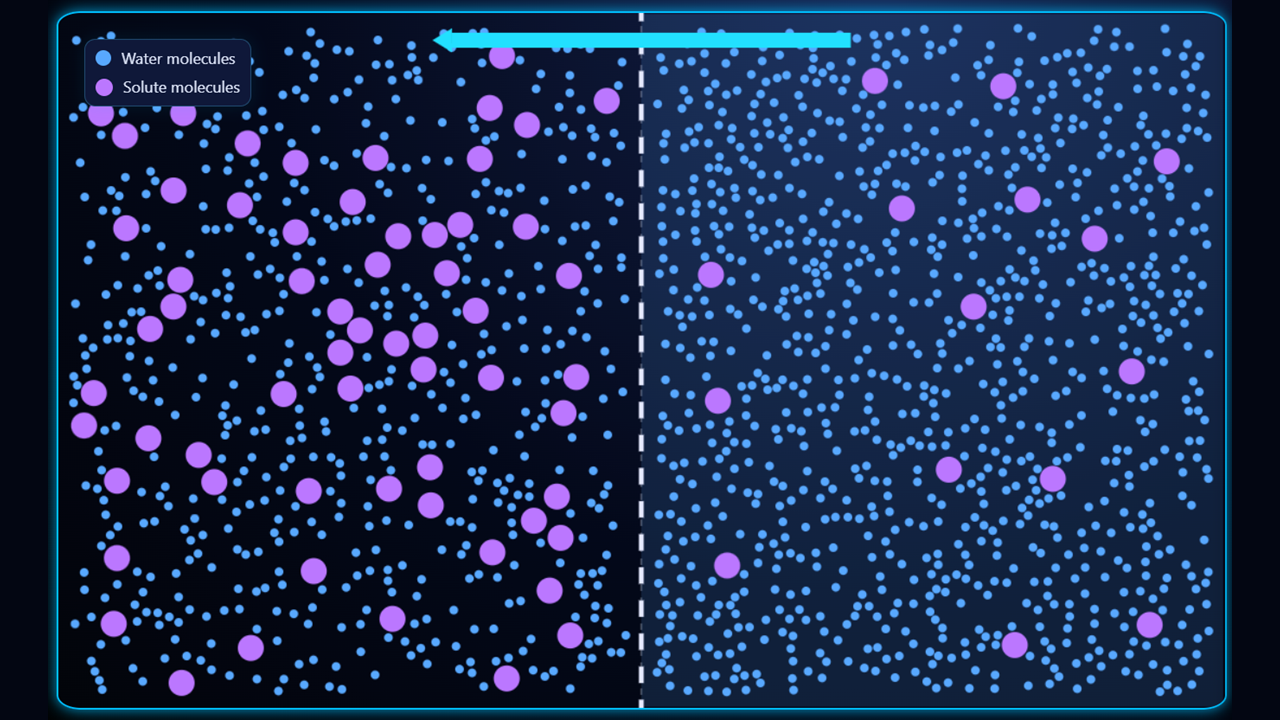
In the first example (above), the left side of the membrane is hypertonic (higher solute concentration, lower water concentration) and the right side is hypotonic (lower solute concentration, higher water concentration) so the water will move from right to left.
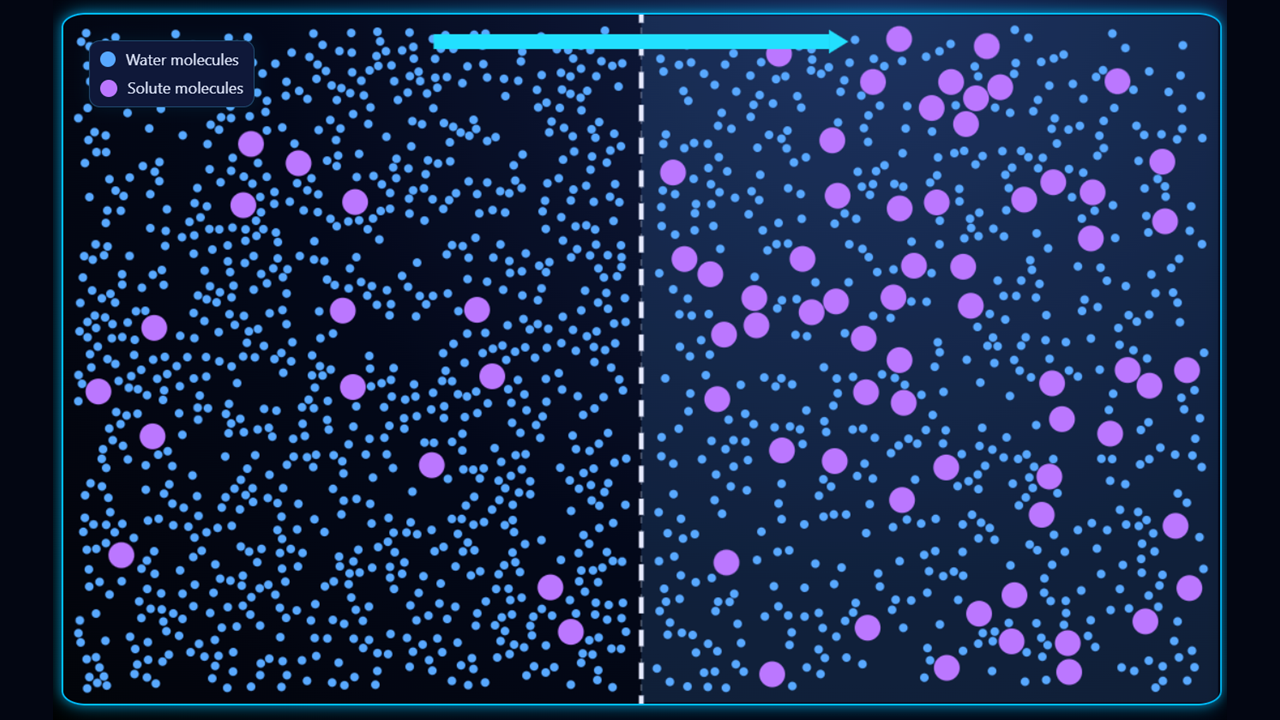
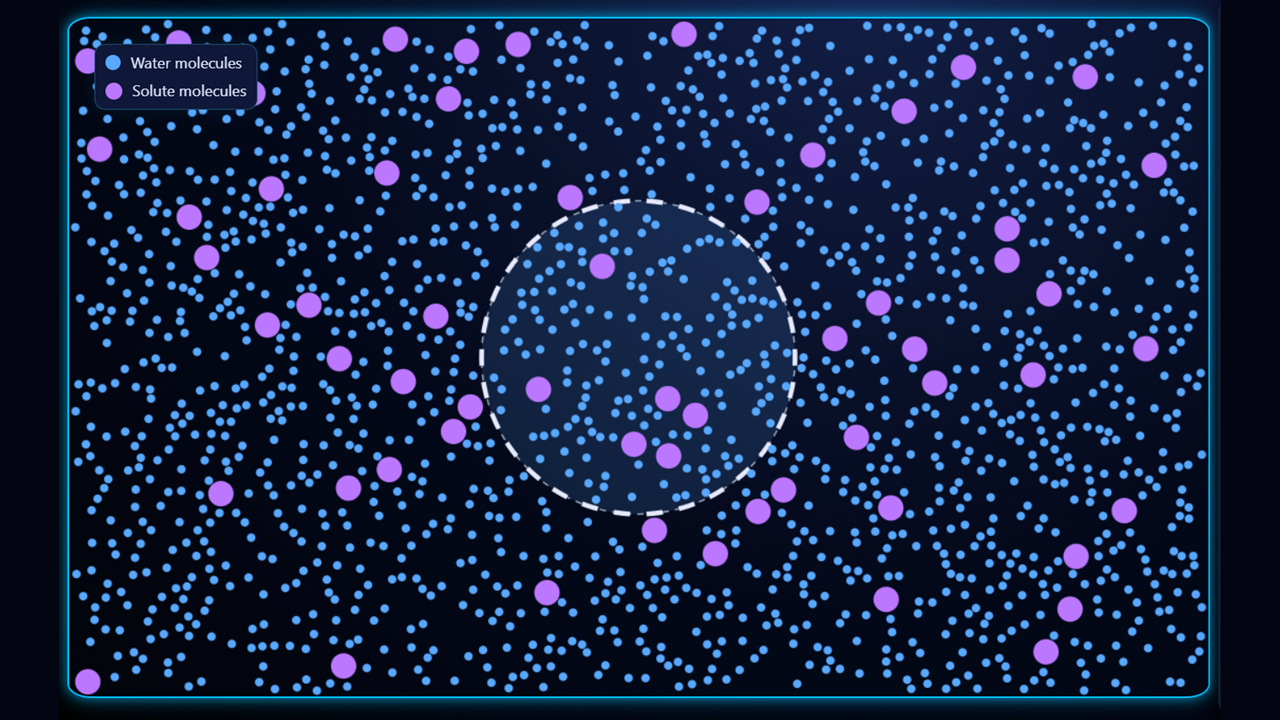
In the second example (above), the right side of the membrane is hypertonic (higher solute concentration, lower water concentration) and the left side is hypotonic (lower solute concentration, higher water concentration) so the water will move from left to right.
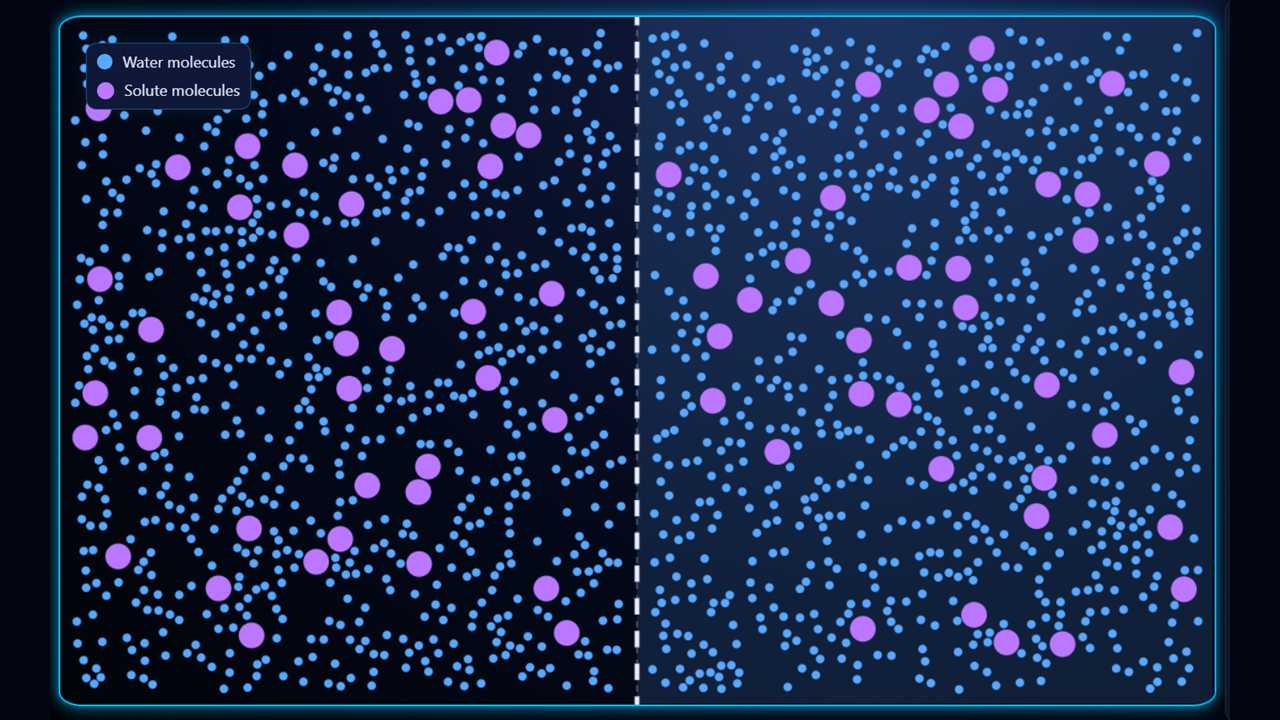
In the third example (above), the solutions on either side of the membrane are isotonic (equal concentrations of solute (and water) on either side of the membrane), so there is no overall movement of water; water does cross the membrane, but the number of crossings in either direction is the same, so there is no overall change.
- Select Left hypertonic from the Conditions drop-down. Hit the Start button and watch how the water molecules move from right to left, from high water concentration to low water concentration. Notice how the membrane moves to the right as the left side expands with water.
- Toggle the Initial state button to quickly flick back-and-forth between the current and initial conditions, to see the change.
- Select some of the other conditions presets and observe the differences in the direction of osmosis.
- Adjust the Temperature slider to see the effect of faster particle movement on the rate of osmosis.
- Select Custom conditions from the Conditions drop-down, and adjust conditions such as the total number of particles, the numbers of solutes on the left and right, and the permeability of the membrane. If you pair this with setting a time using the Show timer toggle and viewing statistics using the Show stats toggle, you can run controlled experiments to explore the effect of changing conditions on the rate of osmosis.
Cell membranes contain many tiny pores (small holes)* in them, allowing some substances—such as water—to easily pass through them, whilst others—such as glucose, salt and other dissolved solutes—cannot. As such, we describe cell membranes as being partially permeable, because some substances can pass through them whilst others cannot.
Osmosis is the diffusion of water across a partially permeable membrane down a concentration gradient from high water concentration to low water concentration. The concentration of water is higher when the concentration of dissolved solutes—such as glucose and salt—is lower, and vice versa, so in osmosis, the water diffuses towards the side with higher solute concentration where the water concentration is lower.
During osmosis, it is the water molecules that have to cross the partially permeable membrane, because the solute molecules cannot pass through the holes in the partially permeable membrane. Osmosis stops once the concentration of water molecules (and therefore solute molecules) is equal on either side of the membrane, however, this does not mean that water molecules stop crossing the membrane, just that equal numbers cross in either direction.
*Note: More formally, these holes are known as pores or channels, and there are many different types for different substances, such as aquaporins which allow water in and out, and glucose transporters which allow glucose in and out. For the sake of understanding osmosis, we can consider that only the aquaporins are open, meaning only water can currently cross the cell membrane.
In osmosis, the water moves from the lower solute concentration (hypotonic) side of the membrane to whichever side of the membrane has higher solute concentration (referred to as hypertonic).
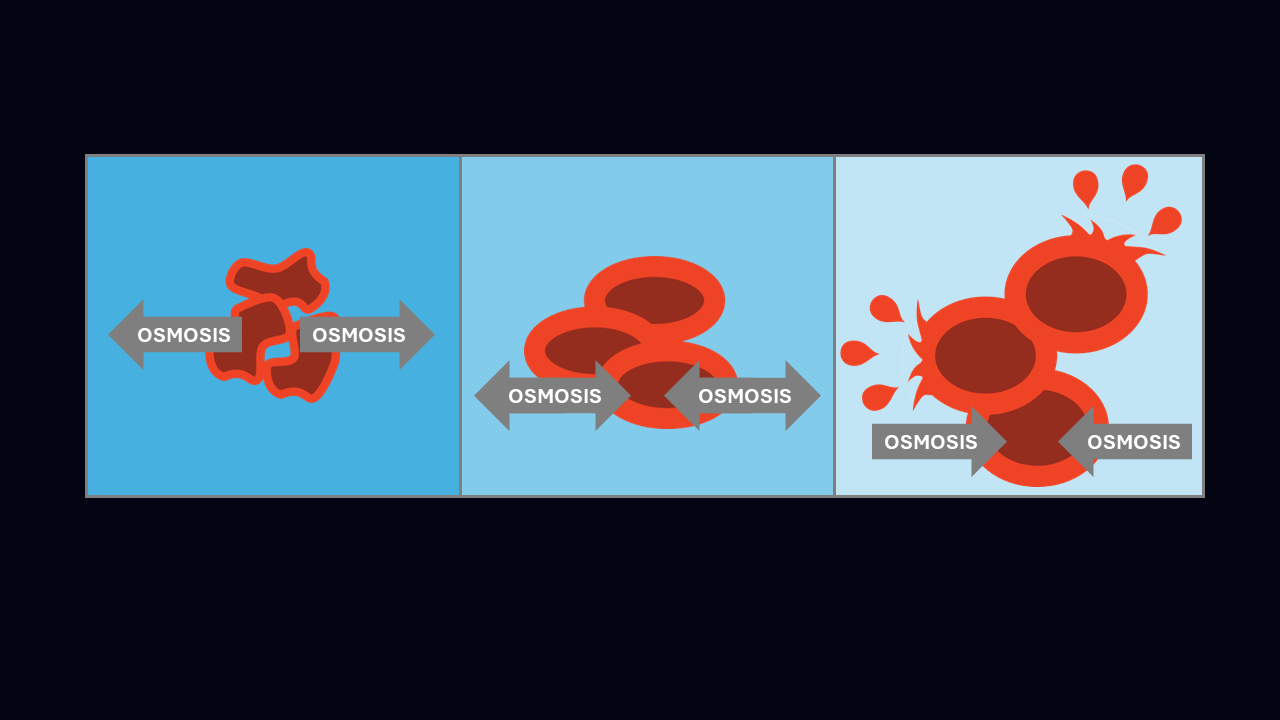
In the first example (above), the outside of the cell is hypertonic (higher solute concentration, lower water concentration) and the inside is hypotonic (lower solute concentration, higher water concentration) so the water will move out of the cell, making it smaller.
In the second example (above), the inside of the cell is hypertonic (higher solute concentration, lower water concentration) and the outside is hypotonic (lower solute concentration, higher water concentration) so the water will move into the cell, causing it to increase in size.
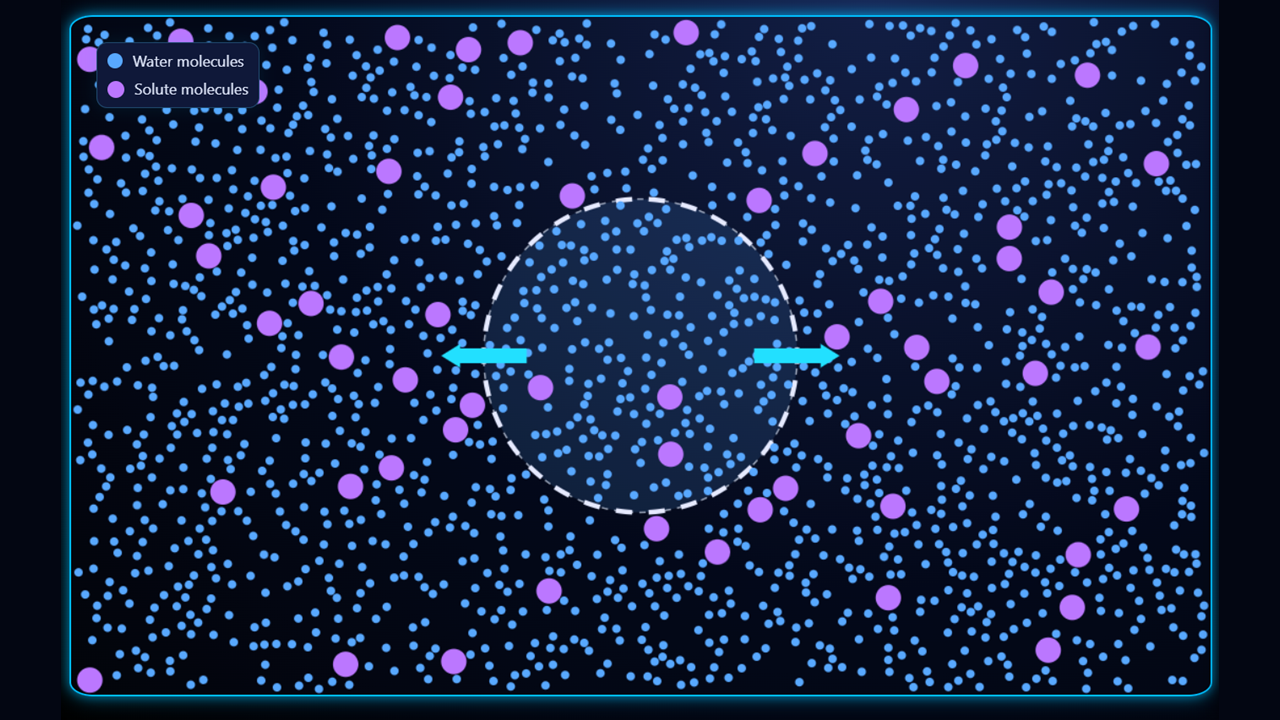
In the third example (above), the solutions inside and outside the cell are isotonic (equal concentrations of solute (and water) on either side of the membrane), so there is no overall movement of water; water does cross the membrane, but the number of crossings in either direction is the same, so the cell does not change in size. You may see some slight change due to the random nature of the movements, but in a real cell, this would be negligible due to the probabilities associated with vast numbers of particles (roughly 100 billion) compared to the small numbers here (~2000).
In the simulation, you will see the cell expand and shrink like a balloon as water enters and leaves it; this is not realistic. In reality, the outcome depends on whether the cell is a plant or animal cell.
When in hypertonic solution, an animal cell will shrivel up as the water leaves it, causing it to function less well, and if too much leaves it, it will die. When in hypotonic solution, if too much water enters an animal cell, it can burst, killing the cell; this is known as osmotic lysis.
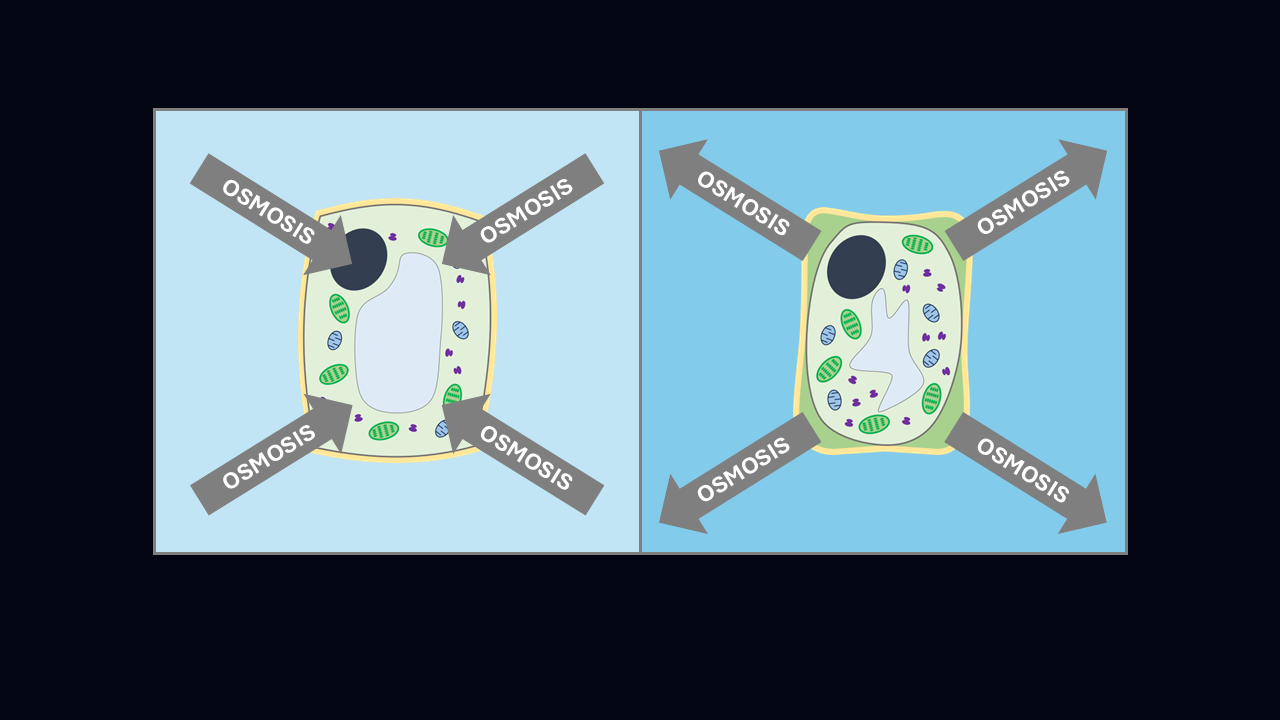
When in hypertonic solution, the cytoplasm of a plant cell shrivels up and pulls away from its cell wall, causing it to function less well and potentially killing it. In hypotonic solution, the cytoplasm of a plant cell swells with water, causing the cell membrane to push outwards against the tough cell wall, making the plant cell turgid, which has a similar effect to the air in a car tyre, supporting the cell without it bursting.
- Select Hypertonic from the Conditions drop-down. Hit the Start button and watch how the water molecules leave the cell, moving from higher water concentration inside the cell to lower water concentration outside. Notice how the cell shrinks as water leaves it.
- Toggle the Initial state button to quickly flick back-and-forth between the current and initial conditions, to see the change.
- Select some of the other conditions presets and observe the differences in the direction of osmosis.
- Adjust the Temperature slider to see the effect of faster particle movement on the rate of osmosis.
- Select Custom conditions from the Conditions drop-down, and adjust conditions such as the total number of particles, the numbers of solutes outside and inside, and the permeability of the membrane. If you pair this with setting a time using the Show timer toggle and viewing statistics using the Show stats toggle, you can run controlled experiments to explore the effect of changing conditions on the rate of osmosis.